 WAWG
WAWG
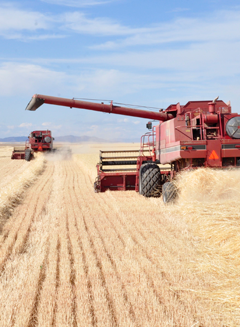 In response to a question by the Washington Department of Agriculture, WAWG’s Executive Director Michelle Hennings and the Washington Grain Commission CEO Glen Squires put together some information regarding the impact the drought had on the past two wheat crops.
For wheat, both 2014 and 2015 had decreased precipitation levels in Eastern Washington, roughly 33 percent less than average levels. Because of that, wheat yields were down 30 to 60 percent for dryland wheat production in Washington both years. Deep well irrigated wheat had 33 to 40 percent yield decreases. Irrigated wheat production yields were down approximately 10 percent below average. Wheat production was the lowest since 1991 after 2014. Production was reported at 17 to 20 percent below the 5-year average statewide.
Those yield losses are the result of the drought in combination with a record heat streak that hit in June, as opposed to July. Eastern Washington had the hottest June on record since 1992, heat that Washington State University’s Ag Weather Net called not just an outlier, a statistical anomaly. Here’s a link to their article about June’s heat wave.
June’s heat wave hit when wheat was still maturing. The heat was harder on plants because of the pre-existing drought conditions, meaning there was a lack of moisture available to the plants which would have offered some protection from the prolonged exposure to heat. Because of the drought, crops were without that protection, and the heat shriveled kernels, devastated yields and caused significantly elevated protein levels. These high protein levels have resulted in tremendous marketing challenges for our industry. Many growers incurred significant financial penalties in the form of protein discounts when marketing and selling their 2015 crop due to high protein.
Long-term impacts come into play for wheat growers because crop insurance is determined by a growers’ actual production history (APH), so the drastically lower yields from 2014 and 2015 brought APH averages down for many growers. This number is calculated on a 4-10 year average, so even for growers with 10 years of production history, farms that have an APH of 35 bushels/acre who experienced yields of 14 for two consecutive years, now have an APH of 30.8 bu/acre. That farm will have lower-costing crop insurance premiums, but will also have less coverage due to the drop in APH.